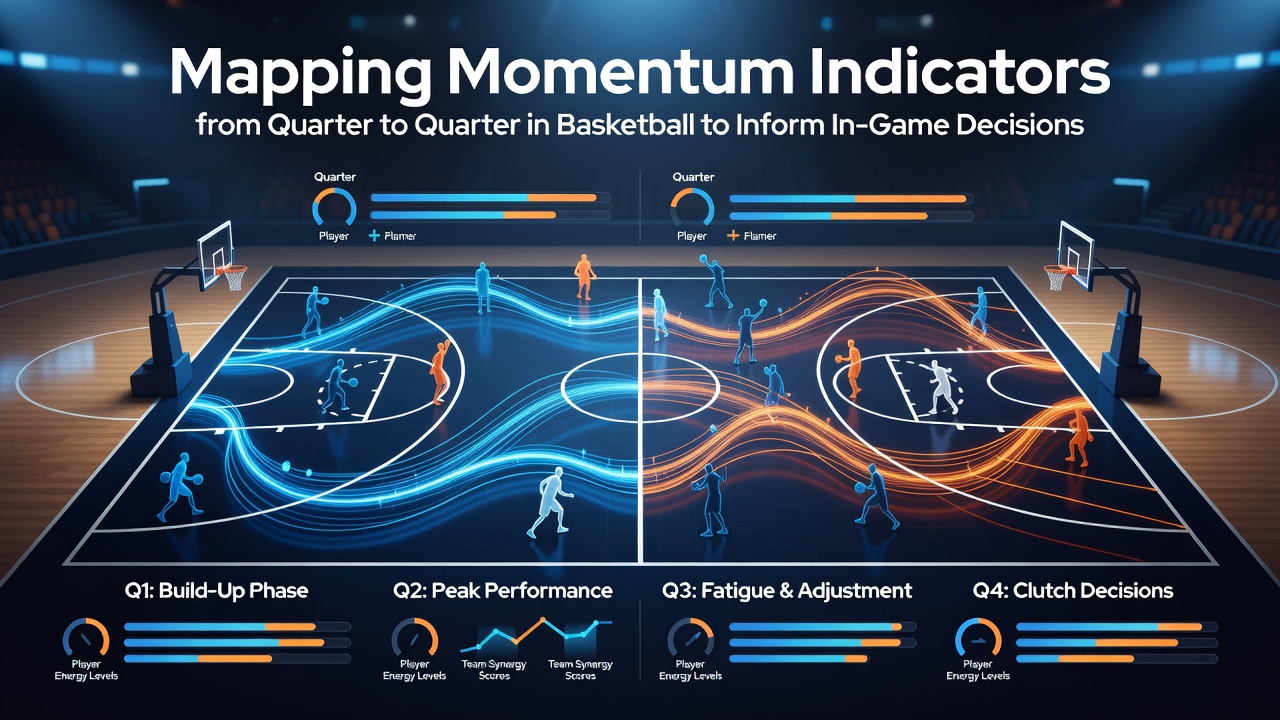
Tracking Quarter-by-Quarter Momentum Patterns in Basketball for Real-Time Tactical Adjustments
Coaches and analysts examine scoring runs, turnover rates, and defensive efficiency shifts between quarters to guide substitutions and scheme changes during games, and data collected from professional leagues demonstrates how these metrics evolve in predictable sequences while remaining responsive to opponent adjustments.
Defining Core Momentum Indicators
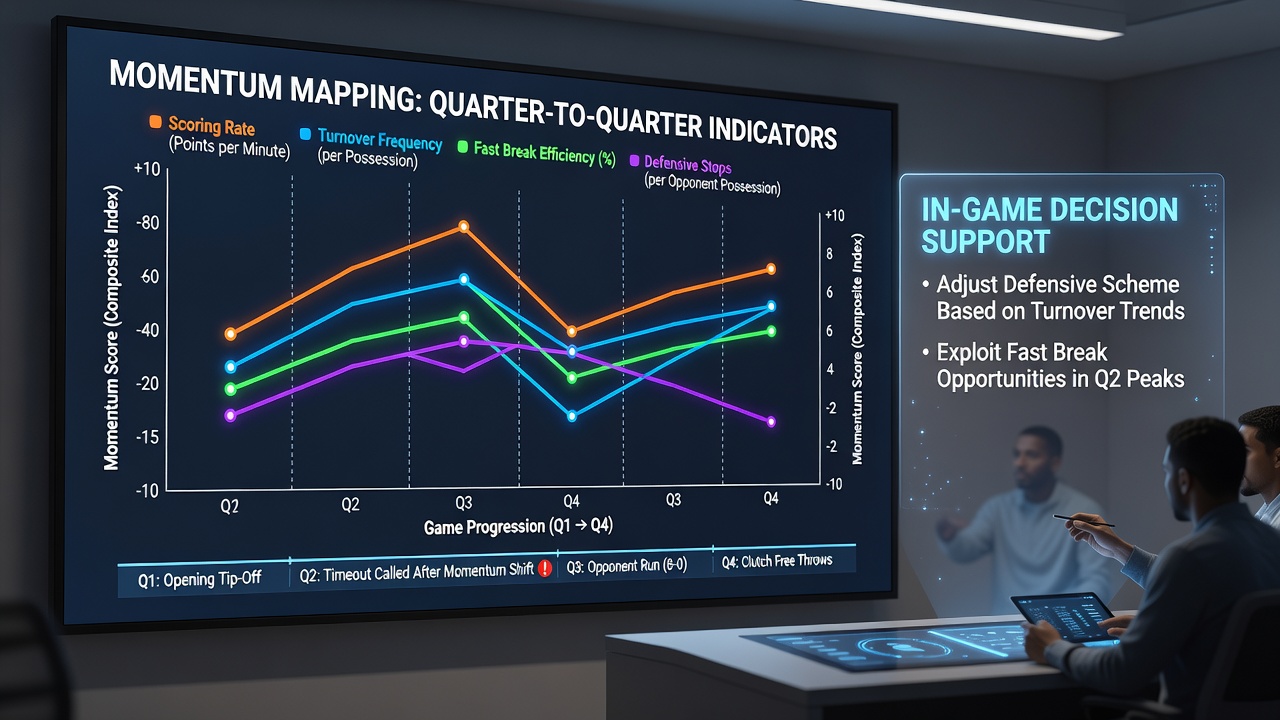
Teams track several measurable factors that signal shifts in control from one quarter to the next, including points scored in transition, opponent field goal percentage on contested shots, and the ratio of assists to turnovers accumulated in each twelve-minute segment, and these indicators often reveal patterns that emerge after the opening quarter when initial fatigue and scouting reports begin to influence execution.
Research from league-wide tracking systems shows that teams maintaining a positive assist-to-turnover ratio above 2.0 in the first quarter sustain higher win percentages when they carry similar ratios into the second period, whereas drops below 1.5 frequently coincide with runs by the opposing side that force defensive resets.
Quarter-to-Quarter Data Collection Methods
Video analysts and performance staff log play-by-play events at the end of each quarter using synchronized timestamps from official game feeds, and this process allows comparison of metrics such as rebounding percentage on both ends and pace measured in possessions per minute across the four quarters, with particular attention paid to how those numbers change after halftime adjustments.
European league reports indicate that clubs employing automated event tagging software complete quarter reviews in under three minutes during timeouts, enabling head coaches to reference exact figures on defensive stop percentage before deciding on lineup combinations for the next segment.
Applying Indicators to Substitution Patterns
Coaching staffs review momentum data to determine which players maintain efficiency in high-possession stretches and which ones experience declines after twenty-four minutes of play, and studies of North American professional teams reveal that frontcourt players averaging above 0.8 points per possession in the first half often see those numbers fall when paired with a new backcourt unit that alters spacing in the third quarter.
One documented case from the 2025-2026 season involved a club that used second-quarter turnover data to insert a defensive specialist earlier than planned, resulting in a 12 percent improvement in opponent points per possession for the remainder of that contest.
Regional Variations in Momentum Tracking
Organizations in different continents apply distinct weighting to the same indicators because of rule differences and game tempo, and Australian league data collected through 2026 highlights greater emphasis on transition defense metrics between quarters compared with slower-paced competitions that prioritize half-court execution stats.
According to reports published by the International Basketball Federation, FIBA competitions show stronger correlations between third-quarter rebounding dominance and final outcomes than NBA games, where fourth-quarter three-point volume exerts more influence on closing margins.
Integration with Video and Wearable Technology
Modern systems combine optical tracking with player-worn sensors to flag fatigue-related drops in sprint speed and vertical leap that appear between quarters, and these layered datasets allow staff to cross-reference physical output against statistical momentum indicators before making rotation decisions in the second half.
University-led projects in Canada have demonstrated that combining heart-rate variability readings with on-court momentum scores improves prediction accuracy for late-game performance dips by approximately 18 percent compared with statistical models alone.
Conclusion
Mapping momentum indicators across quarters supplies teams with structured information that supports immediate tactical choices, and continued refinement of data collection tools across global competitions points toward more precise integration of these metrics into live decision frameworks as the 2026 calendar year progresses.