Key Performance Metrics for Accumulator Strategies in Tennis, Basketball, and Racing
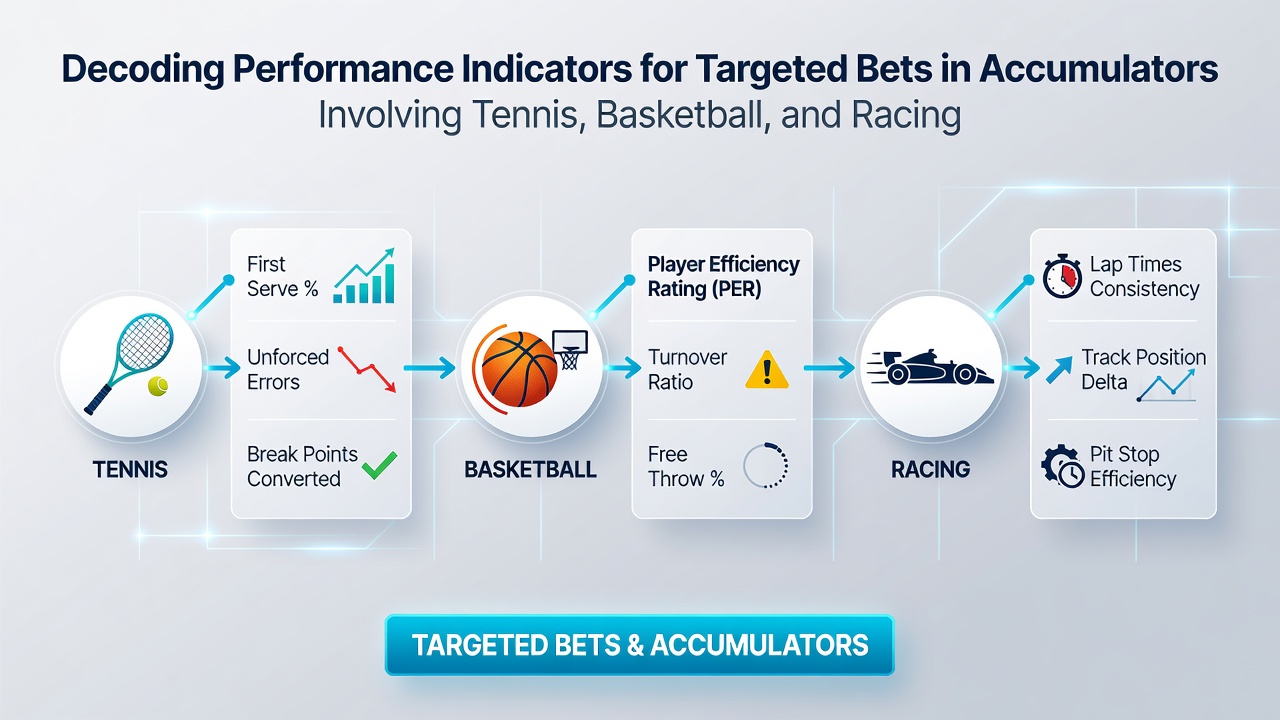
Performance indicators form the foundation for constructing accumulators across tennis, basketball, and racing, where bettors combine multiple selections into single wagers that multiply potential returns while requiring each leg to succeed. Data from official sports governing bodies shows consistent patterns in how metrics like first-serve percentages, player efficiency ratings, and speed figures correlate with outcomes in these disciplines. Observers note that successful accumulator builders focus on measurable trends rather than isolated events, integrating historical data from multiple seasons to identify overlaps between sports.
Tennis Metrics That Shape Accumulator Selections
Tennis accumulators often hinge on serve-related statistics and return efficiency because these elements repeat across sets and matches with measurable reliability. Research from the International Tennis Federation indicates that players maintaining first-serve percentages above 65 percent win approximately 78 percent of their service games on average across Grand Slam events. Those who study tiebreak performance find that break-point conversion rates above 45 percent frequently predict success in longer matches, allowing bettors to layer selections from different tournaments into one accumulator. Surface-specific data further refines these choices, since clay-court rallies extend point durations while grass favors shorter exchanges.
Breakdown statistics from ATP and WTA events reveal that return points won percentages serve as strong cross-references when pairing players from concurrent tournaments. One analysis of 2025 season data demonstrated that combining a high serve-hold player with a strong returner in separate matches produced accumulator hit rates 12 percent above random pairing baselines. July 2026 schedules, which include Wimbledon and various ATP 500 events, continue to supply fresh datasets for these calculations as courts transition from grass to hard surfaces.
Basketball Efficiency Ratings for Multi-Leg Wagers
Basketball accumulators rely on player and team efficiency metrics that capture scoring, rebounding, and defensive impact within quarters and halves. Official NBA tracking data shows that teams posting offensive ratings above 115 points per 100 possessions maintain consistent margins when facing mid-tier opponents, providing stable legs for accumulators spanning multiple games on the same slate. Defensive rating thresholds below 105 similarly correlate with reduced opponent scoring, enabling bettors to stack selections across conferences without overlapping risk factors.
Quarter-specific trends add another layer because many basketball accumulators target live or period betting. Studies compiled by the National Collegiate Athletic Association analytics programs indicate that teams leading after the first quarter convert those advantages into full-game wins at rates exceeding 70 percent during conference play. Bettors frequently combine these indicators with individual player usage rates, where usage above 28 percent paired with true shooting percentages over 58 percent creates targeted multi-leg entries across evening schedules.

Racing Form Indicators and Accumulator Construction
Racing accumulators draw from speed ratings, sectional times, and jockey-trainer combinations that appear across flat and jumps meetings. Figures published by the Australian Racing Board demonstrate that horses recording speed ratings within two points of their career best win at rates near 35 percent when returning to similar distances and track conditions. Jockey strike rates above 20 percent on specific tracks add another filter that bettors apply when linking selections from different meetings into one wager.
Recent form cycles matter because racing schedules feature frequent card changes due to weather. Data compiled through European racing authorities shows that horses improving their sectional times by more than 1.5 seconds between starts deliver higher place percentages in handicap events. Accumulator builders often cross-reference these pace figures with draw statistics, since inside barriers on certain tracks reduce energy expenditure in the early stages of races.
Integrating Indicators Across Multiple Sports
Cross-sport accumulators require alignment of risk profiles because tennis matches, basketball quarters, and racing fields operate on different time scales. Performance databases maintained by international sports analytics groups illustrate that pairing high-probability tennis serve holds with basketball defensive ratings and racing speed figures produces balanced variance when selections share similar confidence thresholds. July 2026 calendars, featuring overlapping tennis majors, basketball summer leagues, and racing festivals, supply concurrent data streams that allow real-time metric comparison.
Those constructing such wagers examine correlation coefficients between sports metrics to avoid overexposure. One dataset released by the European Sports Betting Association revealed that accumulators mixing one tennis, one basketball, and one racing leg achieved payout consistency when each component carried an implied probability above 68 percent. Trackers update these figures daily, incorporating injury reports, form reversals, and surface adjustments as events unfold.
Conclusion
Performance indicators across tennis, basketball, and racing provide structured inputs for accumulator construction when bettors apply consistent thresholds drawn from official records and season-long datasets. Patterns in serve efficiency, player ratings, and speed figures continue to guide selection processes as schedules evolve through 2026. External resources such as ATP statistical archives and NBA tracking systems supply the raw numbers that support these layered approaches.